
Gold Price Trends Explained: The Structural Drivers at a Glance
In mid-August 2026, gold trades at around 4,391 US dollars, or around 3,805 euros, per troy ounce – close to historic highs, up from an annual average of 1,803 US dollars in 2022 and 3,439 US dollars in 2025. Making sense of these moves means looking at a handful of recurring mechanisms: monetary policy and real interest rates, the dollar exchange rate, geopolitical uncertainty, and supply from mine production and recycling.
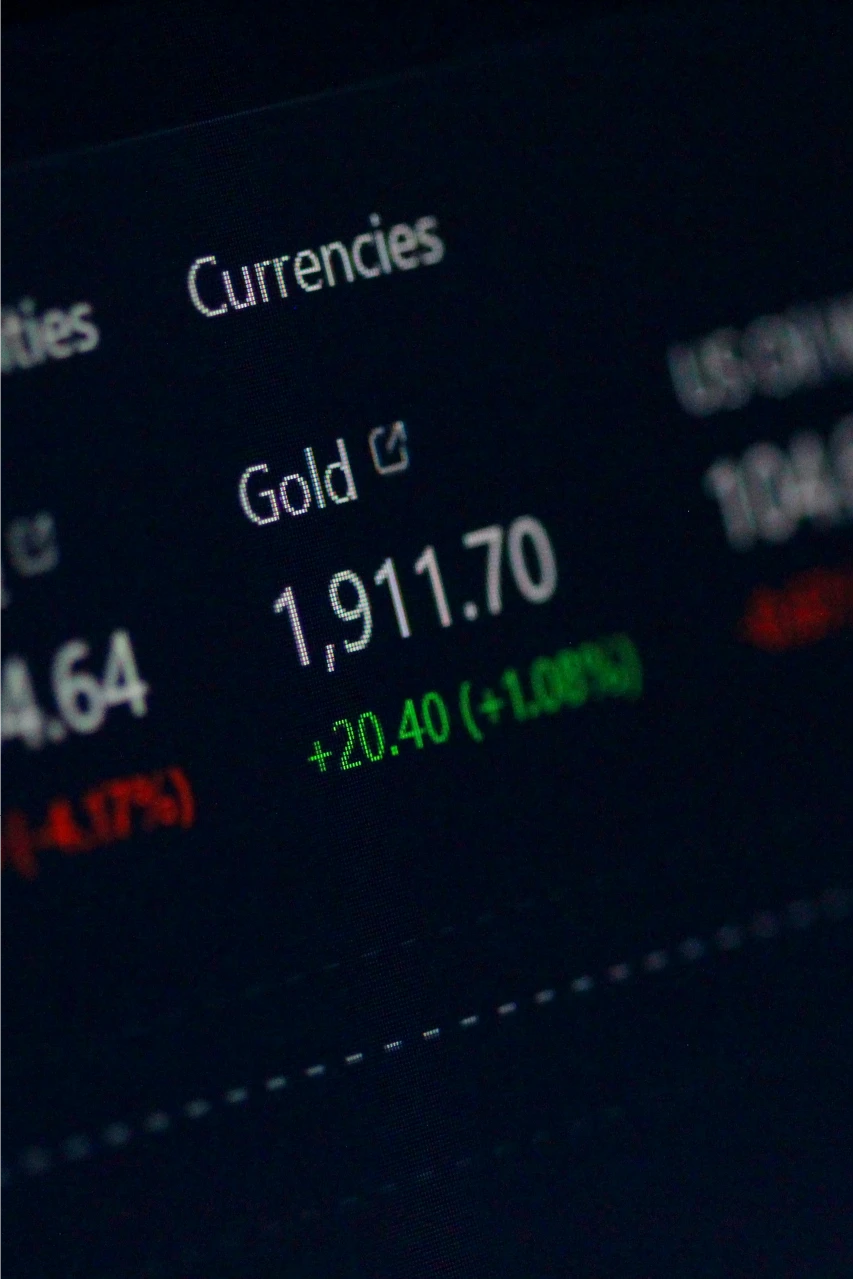
What Drives the Gold Price?
Gold pays no interest or dividends, so its price isn't set by corporate earnings but by the interplay of opportunity costs, currency effects, demand during periods of uncertainty, and a structurally tight supply. Central bank policy and real interest rates form the closest statistical relationship, according to the World Gold Council and market observers alike; the dollar exchange rate, geopolitical crises and the supply side each act as separate, additional layers on top of that.
Central Bank Policy and Real Interest Rates: The Closest Relationship
The real interest rate – the nominal rate minus the inflation rate – determines the opportunity cost of holding gold: whoever holds gold instead of an interest-bearing asset forgoes that interest income. When real rates rise, this trade-off becomes more expensive and gold tends to become less attractive; when they fall or turn negative, the effect reverses. In the eurozone, the ECB deposit rate stood at 2.25 percent in August 2026, while German inflation came in at 2.8 percent in July 2026 according to the Federal Statistical Office (Destatis) – meaning the real rate was running slightly negative. In the US, yields on 10-year Treasury Inflation-Protected Securities (TIPS) were, according to the World Gold Council, trading near 2.5 percent, a level historically associated with subdued ETF demand, while the Federal Reserve held its policy rate steady at 3.50 to 3.75 percent. What matters most is not the absolute level of any single rate but its expected direction: anticipated rate cuts tend to support the gold price, anticipated hikes tend to weigh on it.
The Dollar: Why the USD and EUR Gold Price Can Diverge
Gold is traded internationally in US dollars, but eurozone investors pay in euros – creating a second layer of price movement independent of the gold price itself: a strong euro makes gold cheaper for them, a weak euro makes it more expensive. This was clearly visible in 2022: the dollar gold price had already hit its high back in 2020 during the pandemic (around 2,063 US dollars), yet the euro gold price reached a new all-time high following Russia's invasion of Ukraine, driven by a euro that was weakening at the same time. The same effect shows up in 2026: over the course of the year, gold rose by around 3.0 percent in euro terms but only around 1.2 percent in dollar terms – part of any price move euro-based investors see is therefore a currency effect, not a gold price move in the narrower sense.
Geopolitical Uncertainty: Safe-Haven Demand and Its Limits
In times of crisis, capital flows into gold because it is seen as an asset with no counterparty risk and isn't tied to any single currency system: in 1980 the Iran hostage crisis and the Soviet invasion of Afghanistan drove the price up, in 2011 the European debt crisis pushed it to a then-record high above 1,900 US dollars, in 2020 the pandemic took it to around 2,063 US dollars, and in 2022 the war in Ukraine drove the euro record mentioned above. Such rallies, however, are typically temporary and partly reverse once the acute uncertainty fades – as the historical review below shows using 1980 as an example. Central bank demand, by contrast, is more structural in nature: according to the World Gold Council, central banks bought more than 1,000 tonnes of gold net per year from 2022 to 2024, and around 863 tonnes in 2025 – well above the roughly 473-tonne average seen between 2010 and 2021, driven mainly by diversification away from the US dollar. Germany's Bundesbank itself holds the world's second-largest gold reserves, at around 3,350 tonnes.
Supply-Side Factors: Mine Production and Recycling
Unlike many other commodities, gold supply barely responds to price changes in the short term, since new mining projects often take a decade or longer to reach production. According to the World Gold Council's Gold Demand Trends, global mine production stood at 965.6 tonnes in the second quarter of 2026 (up 2 percent year-on-year), while recycled supply came in at 326.1 tonnes (down 6 percent) – leaving total supply of 1,268.9 tonnes almost unchanged from a year earlier. The fact that recycling did not rise despite high prices suggests that holding behaviour and expectations of further price gains also shape the supply side.
Historical Context: What Has Moved the Gold Price in the Past?
Free price formation only began with the end of the Bretton Woods system in 1971. In 1980, the annual average stood at 613.88 US dollars amid record inflation and geopolitical crisis, followed by a multi-year bear market; in 2008 the financial crisis pushed the average to 871.34 US dollars; in 2011 the debt crisis drove the price to a high above 1,900 US dollars (annual average 1,572.94 US dollars); in 2020 the pandemic brought a new high of around 2,063 US dollars; in 2022 the average stood at 1,803.11 US dollars amid the war in Ukraine. 2025 then saw a rally to new record highs above 4,000 US dollars (annual average 3,439.37 US dollars) – according to market observers, a combination of central bank buying, falling real interest rates and geopolitical uncertainty, rather than the result of any single trigger. The pattern repeats itself: rarely is it a single factor, more often the convergence of several of the drivers described above.
Conclusion
The gold price cannot be traced back to a single cause; it results from the interplay of real interest rates, the dollar exchange rate, geopolitical demand and a structurally limited supply – with central bank policy and real interest rates historically forming the closest single relationship. Because policy rates, inflation and exchange rates keep changing, the figures cited here should always be checked against current market data. Anyone using this overview as a basis for building a physical gold position should next look into secure storage: more on that in the guide to storing gold.
Gold Price Trends Explained: The Structural Drivers at a Glance
Gold price trends explained: how real interest rates, central bank policy, the dollar, geopolitics and supply interact – with current data from the World Gold Council and Bundesbank.
Gold as an Inflation Hedge: What the Data Really Shows

Buying Silver: Why You Pay VAT – But Not on Gold
Gold Price Trends Explained: The Structural Drivers at a Glance
Gold as an Inflation Hedge: What the Data Really Shows